Support the Blog — Buy This Book!
 For Kindle and with free ePub version. Only $9.49 Great reading.
Here is what Gary Shapiro CEO of the Consumer Electronics Association (CEA) said: Dvorak's writing sings with insight and clarity. Whether or not you agree with John's views, he will get you thinking and is never boring. These essays are worth the read!
For Kindle and with free ePub version. Only $9.49 Great reading.
Here is what Gary Shapiro CEO of the Consumer Electronics Association (CEA) said: Dvorak's writing sings with insight and clarity. Whether or not you agree with John's views, he will get you thinking and is never boring. These essays are worth the read!
Put this ad on your blog!

Syndicate
Subscribe to Main Blog feed here:


Subscribe to Comments too (below):
Junk Email Filter


This would be more complete if they showed taxes as one of the slices of the chart…
What a load of BS!
Where’s the beef? (taxes)
Classic liberal spin – a total waste of a posting.
And this came from the government – I thought it might have been the NY Times or the Daily Kos.
Yeah, I saw the lame comment about discretionary spending. It’s just like how the media that bury the important description of the front page headline at the bottom of page C-14.
Hey, how about a pie chart showing discretionary spending comparison – 2007, 2009, and 2011.
charts show what charts show. Where is the number of acres lost to forest fires/floods/drought/wind etc?
This chart is not about that subject?
Nevermind.
Bobbo, read the headline again.
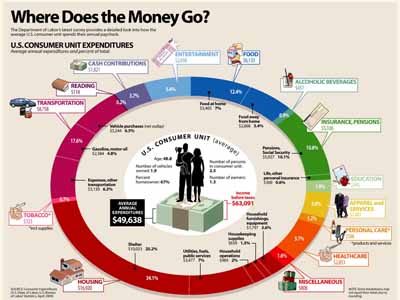
The chart is about Where Does The Money Go?
Piece of crap. Where are the taxes in the pie chart?
#6–JB==yes, I almost posted that from the chart, one would/should assume that “the average” consumer did not pay taxes. But I thought that did not honor the effort our editor put into highlighting the refinement of
– – – – DISCRETIONARY SPENDING – – – – – –
I prefer being irrelevant than taking cheap shots that are off point and not helpful.====Although, I do think taxes are very important, so is the amount of Vitamin D in your diet.
Every chart can’t cover every issue—only dirt clods ignore that fact.
“Where are the taxes?”
It couldn’t possibly be the difference between ‘Income Before Taxes’ and ‘Average Annual Expenditures’, could it? That would be too easy for someone of even average intelligence to figure out. And, as Bobbo points out, the chart is about discretionary spending which taxes are not.
#7,
Right there in the center where is says “Income before taxes”
Bobbo,
Try and find the words DISCRETIONARY SPENDING on the chart. As I said, Uncle Dave added it to his own post at the bottom, but that does not make the chart any more truthful.
If you analyze the income before taxes with the spending, you will see that TAXES are the 2nd largest amount (just behind housing at 34%)
The Department of Labor wants bury that sort of damning information.
Ooopsie
Still, the government, AND ITS SHILLS, do have an overweening interest in keeping the great American Public asleep. “Good”/Advocacy reportage would include the tax burden and the national debt at every opportunity. This chart, is by that view, somewhat of a diverstisement.
At least entertainment and alcohol have additional tax consequences. Lots of “fees” amounting to taxes with some of the others.
Death and Taxes.
Of similar interest, would be an analysis of the charts expenses==how much tax revenue is generated by these transactions?
#11–JB==of course, we agree.
Still–do we need labels to do our thinking for us? Are things most properly what they ARE, or what they are labeled? Is it not perfectly clear what the chart is about?
Surely, the best criticisms are from a broader more inclusive perspective, not a pin prick.
#12,
I agree. They should point out that every penny that this hypothetical family pays in taxes overwhelingly goes to the Iraq War and Nuclear missle submaries that will never be used, and nuclear tiped ICBMs that will never be fired.
It should point out that every other last function of government is paid for by raiding that 10% of their discresionary spending that the chart lists as Social Security.
#14–Postman==”It should point out that every other last function of government is paid for by raiding…..Social Security.” /// I missed that. Thanks.
Yes, the chart is surely meant to keep us at sleep. But doesn’t one question/fact/argument always lead to another? Thinking–its a process not a conclusion.
#15: I think you’d be surprised how far right my views actually are. At least on economic issues. Social issues are a different matter.
The problem here is people aren’t reading what’s written on the chart. Wanting it to be something it isn’t.
#13 Bobbo asks Still–do we need labels to do our thinking for us? Are things most properly what they ARE, or what they are labeled? Is it not perfectly clear what the chart is about?
What you have described is exactly what the media has been doing for years. They spin the information in the way that fits their template.
Hide a figure that represents 33% of the entire chart?
And Obama Transparency? Climate Czar Carol Browner is playing her czar character a litte bit too realistically when she told the Auto Industry Task Force to leave no record of the negotiations, or for that matter, no record of anything at any time.
I have to wave the bull excrement flag on this too. They are hiding taxes.
Most of my money goes to paying off debt. Payments to credit card and student loan companies are missing from the list.
Golly gee. Someone had better tell the Japanese electronics manufacturers they’re wrong:
http://tinyurl.com/mck9a8
# 17 Uncle Dave said, “#15: I think you’d be surprised how far right my views actually are. At least on economic issues.”
Oh, like when you called fiscal conservatives hypocrites for wanting a return on their government forced retirement investments? You never explained that bizarre viewpoint.
I also use the label “fiscal conservative and social liberal”–it sets up a nice balance==even a ying/yang sort of thing if I may be only a little bit imprecise.
#21–patrick==there is no such thing as a government forced retirement investment. Maybe thats why you got no response—just too stupid to acknowledge.
#19
I would assume that student debt and credit cards would fall under education and whatever you decided to buy with your credit cards.
# 23 OvenMaster said, “Or are the options of living off the land, naked in a cave now considered viable alternatives?”
Give it time. O’mama is working on this.
Good luck with living in a cave……real estate taxes will eat you alive.
Here’s something we won’t see UD blogging about.
Even though he liked to cover the same issue with Bush..
Hey, JCD, this would make a fun topic…
You guys are blabbering about trivialities and don’t get to the bottom line of the picture:
Housing is one third, transportation is almost one quarter and Reading is 0.2% and education is a bit under 2%.
And people still wonder why everything is going down the drain…
when education spending is half of entertainment spending and reading is less than alcohol spending.
# 28 JoaoPT said, “Housing is one third, transportation is almost one quarter and…” taxes about one third…
The title of the chart:
“Where does the money go?”
If you leave off 1/3rd or more of where the money goes, it’s a very misleading picture.
Dan
Hmm,
interesting.
Person getting $63k per year. And after tax still has $49K, His wife dont work and he has a kid?
So this person at 48, is making $31 per hour??
10% to retirement??
5.7% to health care?? someone PLZ find this.
House for $1200+ per month..I wish I could aford 1/2 of this stuff.
Can someone tell me where this person lives?
Utilities cost him 7%?? $3430 for the year??
He has a high paying job, Lives in a great house, and his utilities payments are LESS then mine??
This person gets to eat $500 per month in Food??